Our Data Runs Deep
Unbiased, data-driven decision making - it’s why investors and maritime shipping companies trust our solutions every day.
Current global shipping routes
Every Signal, Tracked
Since 2009, we’ve collected billions of data points each day to systematically measure global maritime trade and interpret the activities of the worldwide fleet among more than 150 coastal countries.
HOW WE DO IT
An experienced, world-class technical team, guided by scientific method and inspired to transform maritime trade through data and technology.
We systematically model an estimated $9 trillion of global maritime trade and the activities of more than 100,000 vessels across 150 coastal countries. We deploy physical modeling, statistical modeling and machine learning techniques when appropriate. We are emphatic with respect to automation and rigorous in our efforts to provide data and solutions that are trustworthy for business critical decision making.
Our products
12+ years
of point-in-time seaborne trade & commodity data
90%
volume of global trade transported by sea
$9 trillion
annual seaborne economic activity
Featured
Enhancing investment research and trading with alternative maritime data
Hundreds of time series on commodity fundamentals and maritime economic activity with over a decade of history, designed for quantitative financial research and analysis, and the development of uncorrelated systematic trading signals.
Investment Management
How We Crunch The Data
Data Snapshots
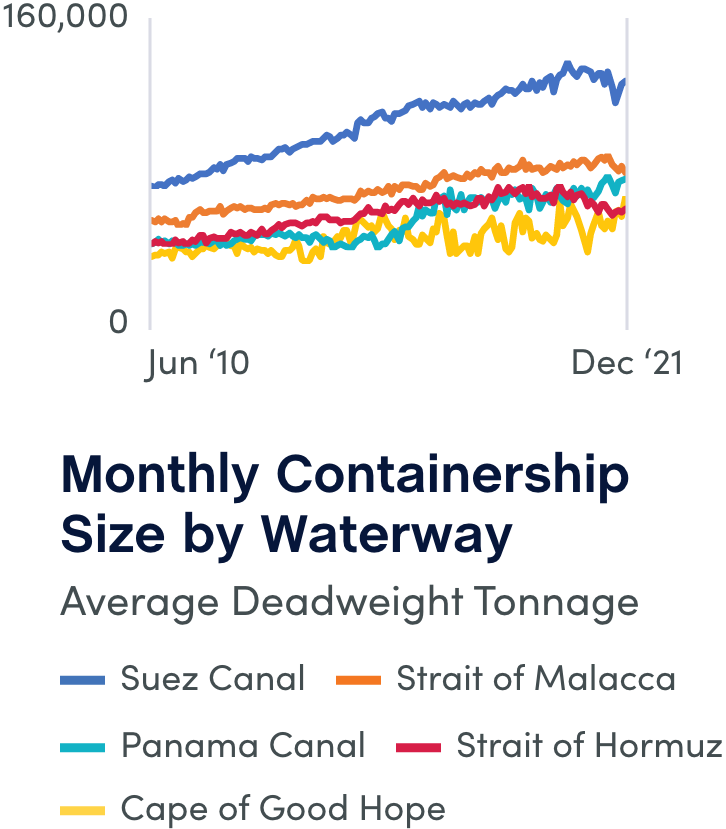
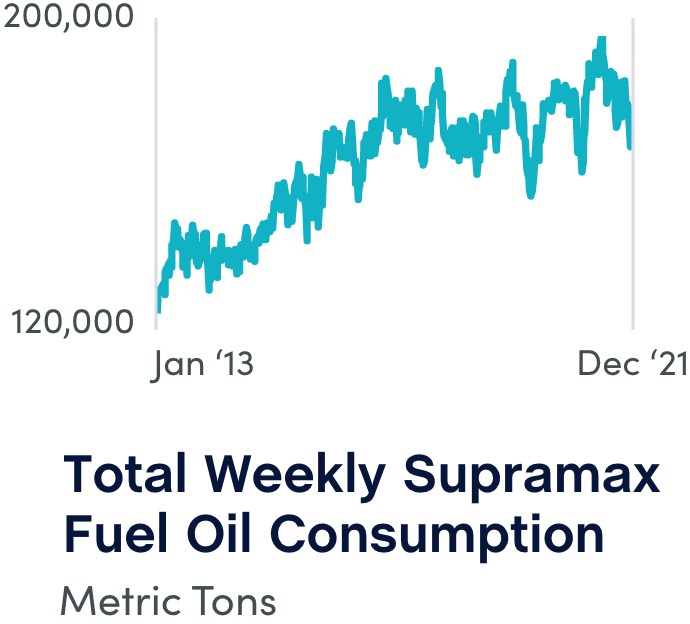
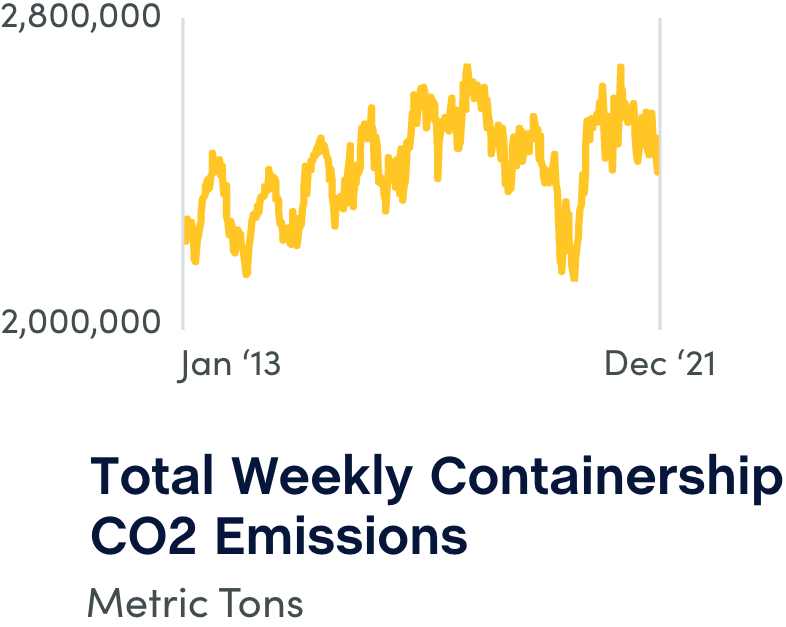
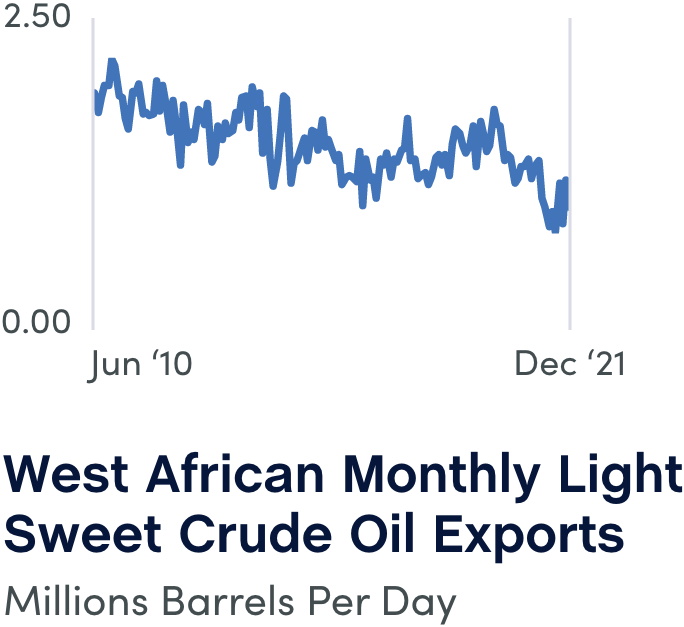
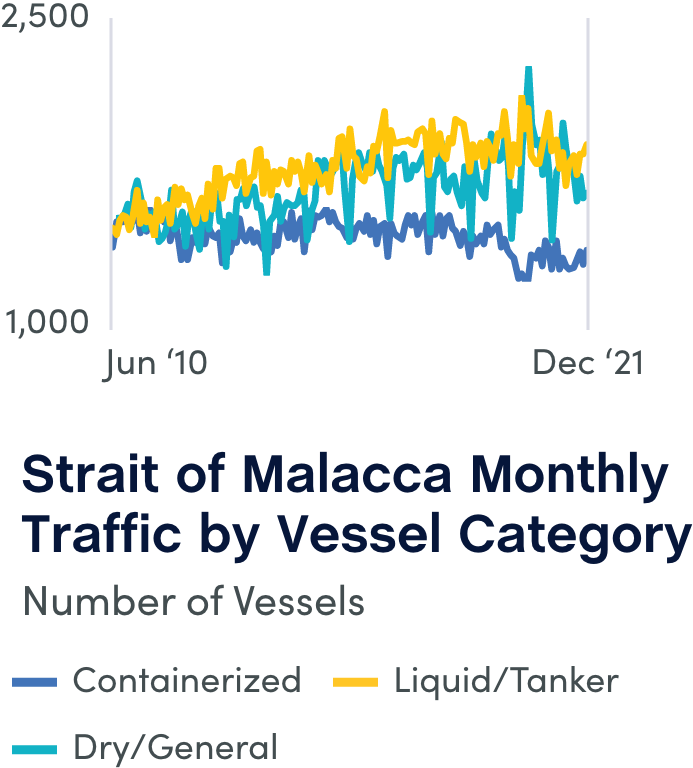
We used our compiled data to create the material and region-specific visualizations below. Visit our Knowledge Base for more detail on these and other segments.
Latest Datasets
Maritime Emissions
CargoMetrics has created the most comprehensive and insightful datasets for monitoring carbon emissions and fuel consumption. These datasets are well suited for a wide range of applications by ship owner/operators, cargo owners, ship brokers, multinational corporations, and hedge funds and other investors.
The European Union Emissions Trading System (EU ETS), the world’s leading greenhouse gas trading scheme, requires certain industries - including shipping - to report and offset carbon emissions. CargoMetrics tracks daily tons of maritime CO2 emissions in accordance with EU ETS rules allowing organizations to analyze trends, model carbon emissions, inform EU Allowances trading decisions, and provide context to regulatory requirements.

