Black Sea Grain Exports: Historical Trends, Volatility, and Financial Markets

The Benefits of Using Historical Data to Contextualize Commodity Flows Events
Ukraine, Russia, Romania, and Bulgaria, all with coastlines along the Black Sea, account for 10-15% of grain exports globally. The grains—primarily wheat, corn, and barley—play a crucial role in global food security and trade, with financial markets closely watching Black Sea flows to inform investment decisions and assess risk.
Russia’s invasion of Ukraine in February 2022 and the subsequent Black Sea Grain Initiative put a spotlight on the area and the geopolitical tensions that have been at the forefront of grain trade discussions.
A Two-Sigma Event
The CargoMetrics Grains Pack – Advanced dataset enables a detailed analysis of real-time grain exports from Ukraine and its neighbors and provides a valuable historical perspective that allows users to understand the impact of Russia’s invasion of Ukraine in the context of past patterns and trends. With daily data on global imports and exports of grains by country, and a point-in-time history from 2013, the dataset allows users to monitor ongoing Black Sea grain exports and compare them against more than a decade of harvest cycles, providing valuable insights into market trends, production stability, and the impact of geopolitical events.
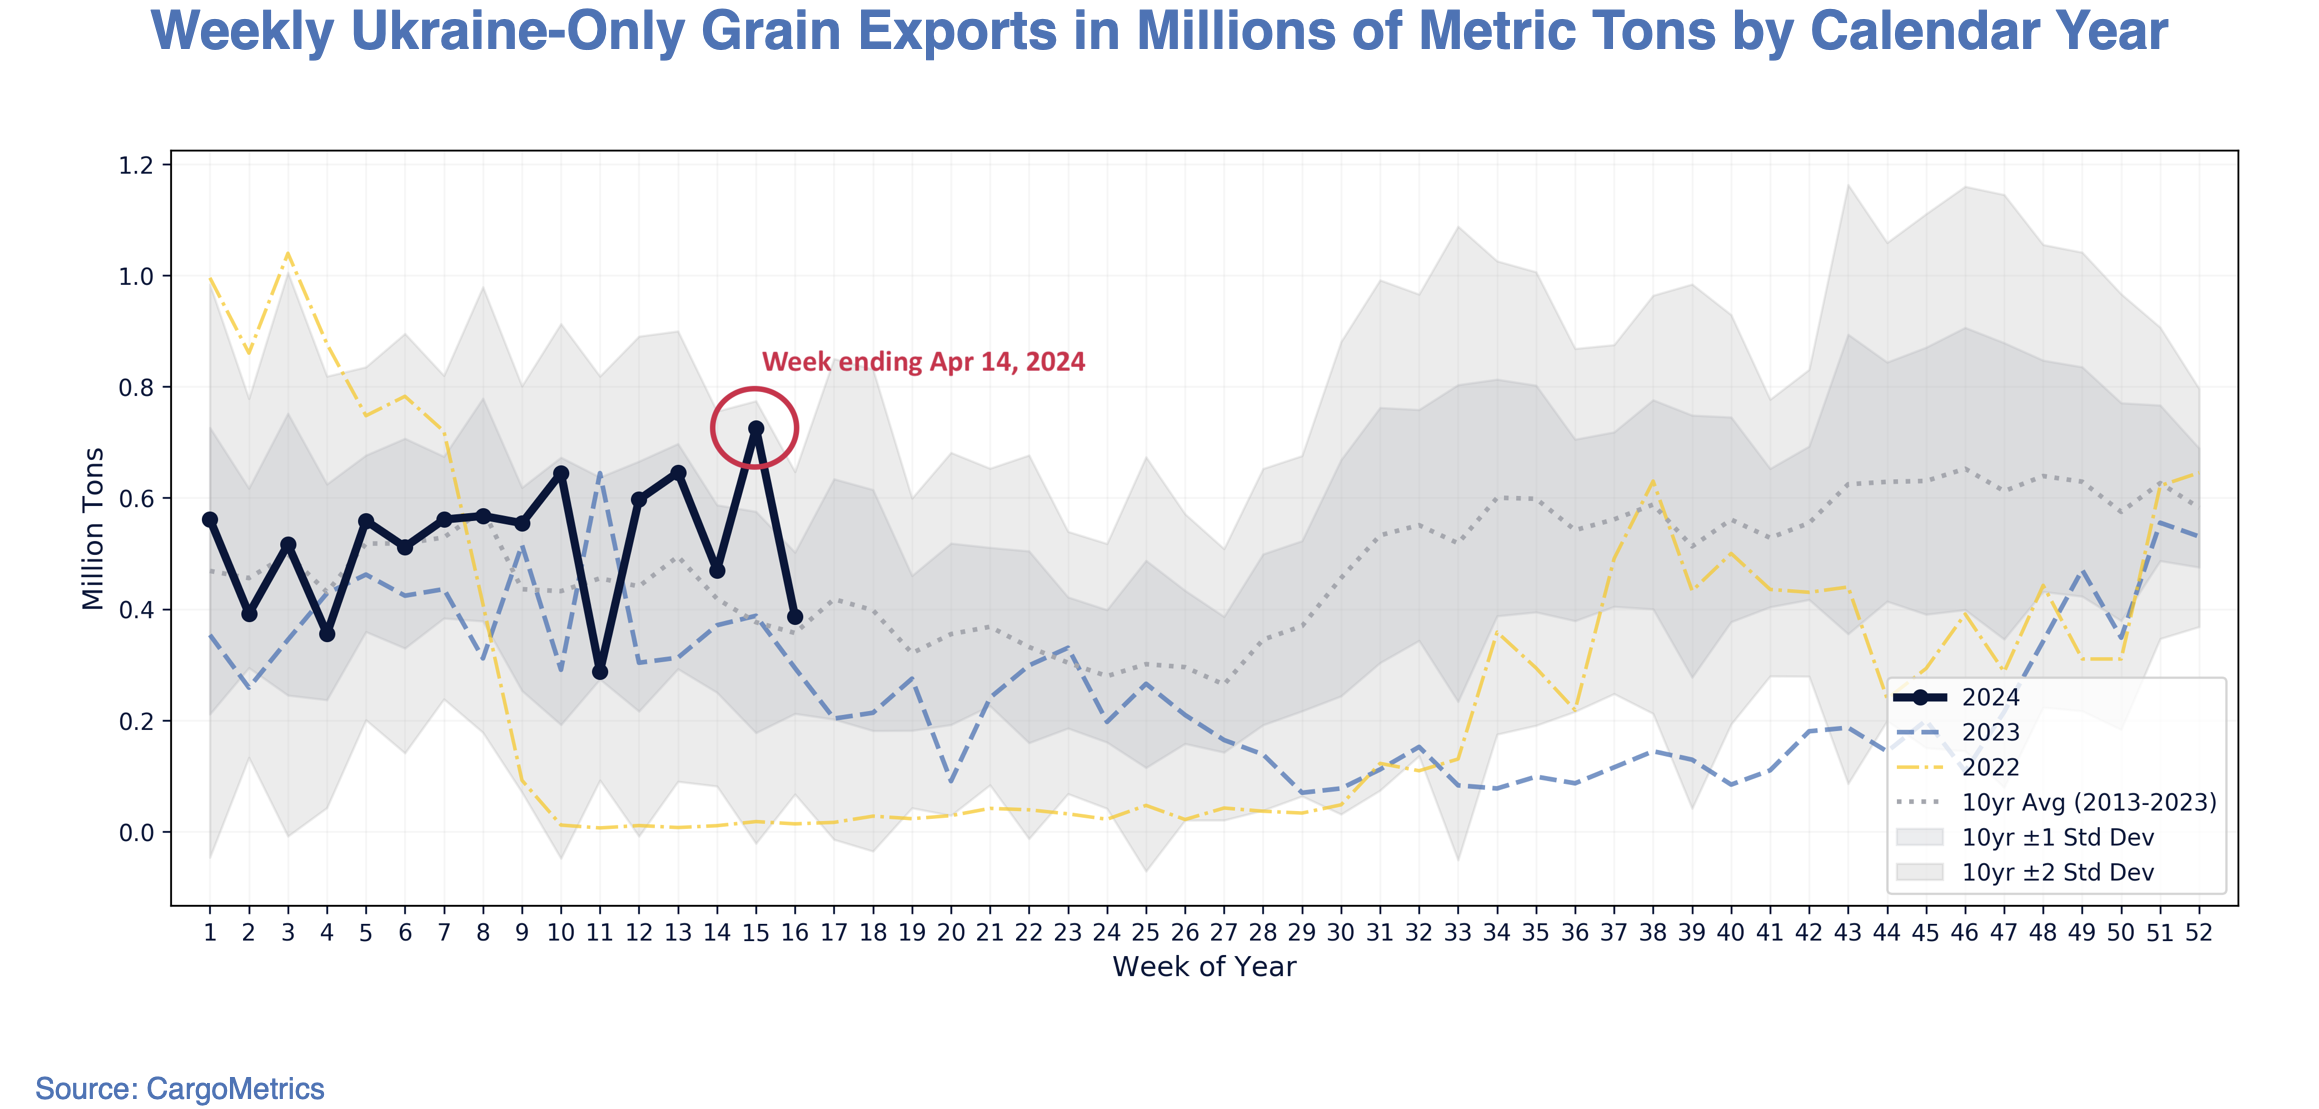
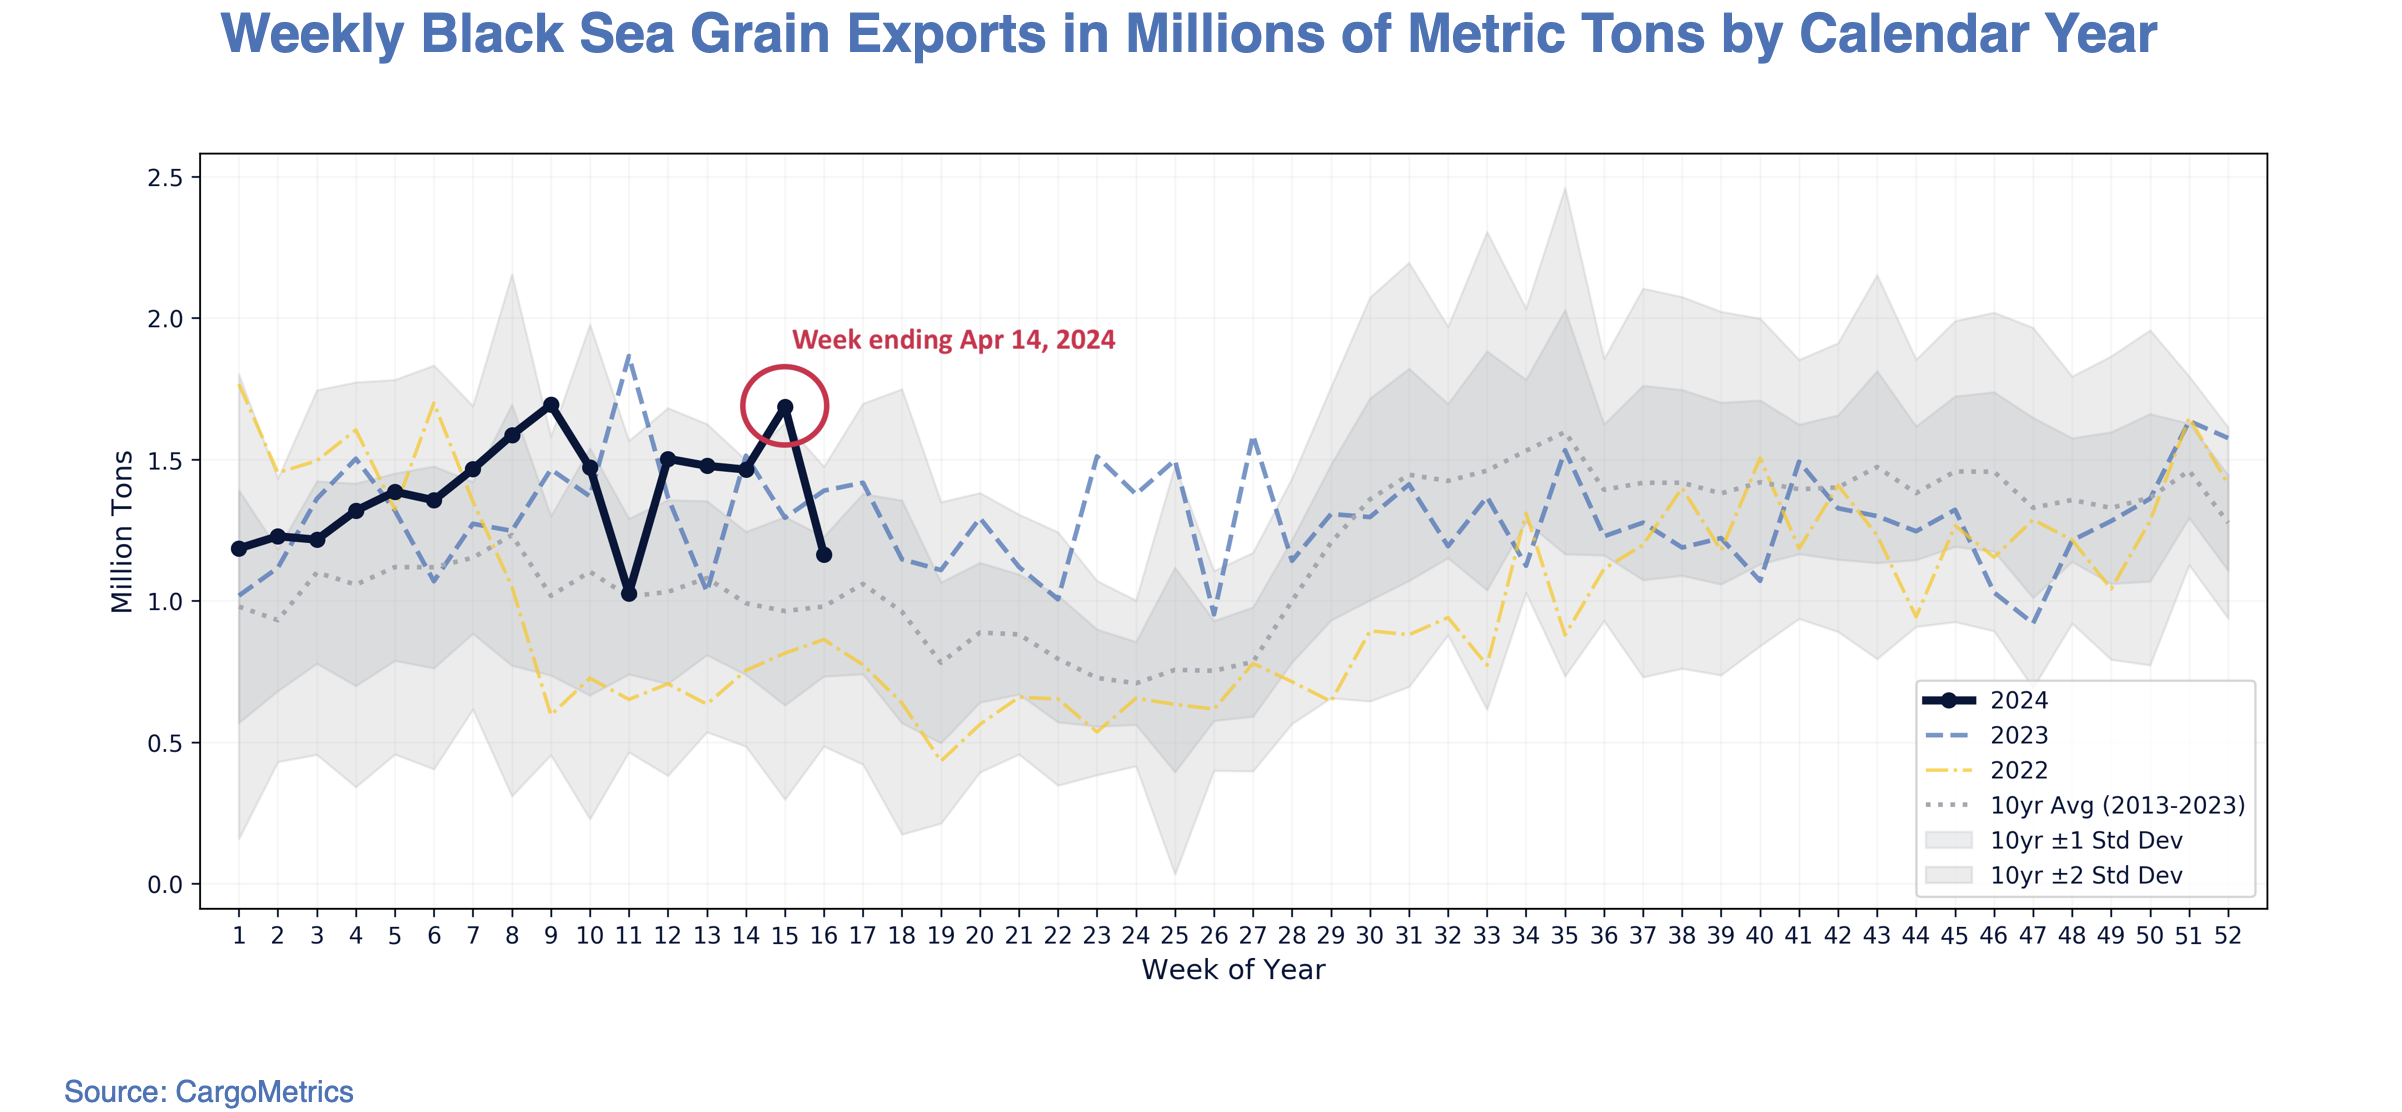
The weekly data show the volatility in Ukraine’s grain exports since the Russian invasion, with frequent negative, lower bound deviations in 2022 and 2023. In the first four months of 2024, Ukraine grain exports experienced significant week on week volatility, with a sharp, positive deviation from the ten-year average—a statistical two-sigma event— for the week ending April 14, 2024 before reverting to the 10-year average for the week ending April 21. In fact, aggregate Black Sea grain exports from Ukraine and its neighbors—Russia, Romania, and Bulgaria—experienced a similar two-sigma event in exports before returning in the following week to levels closer to the 10-year average.
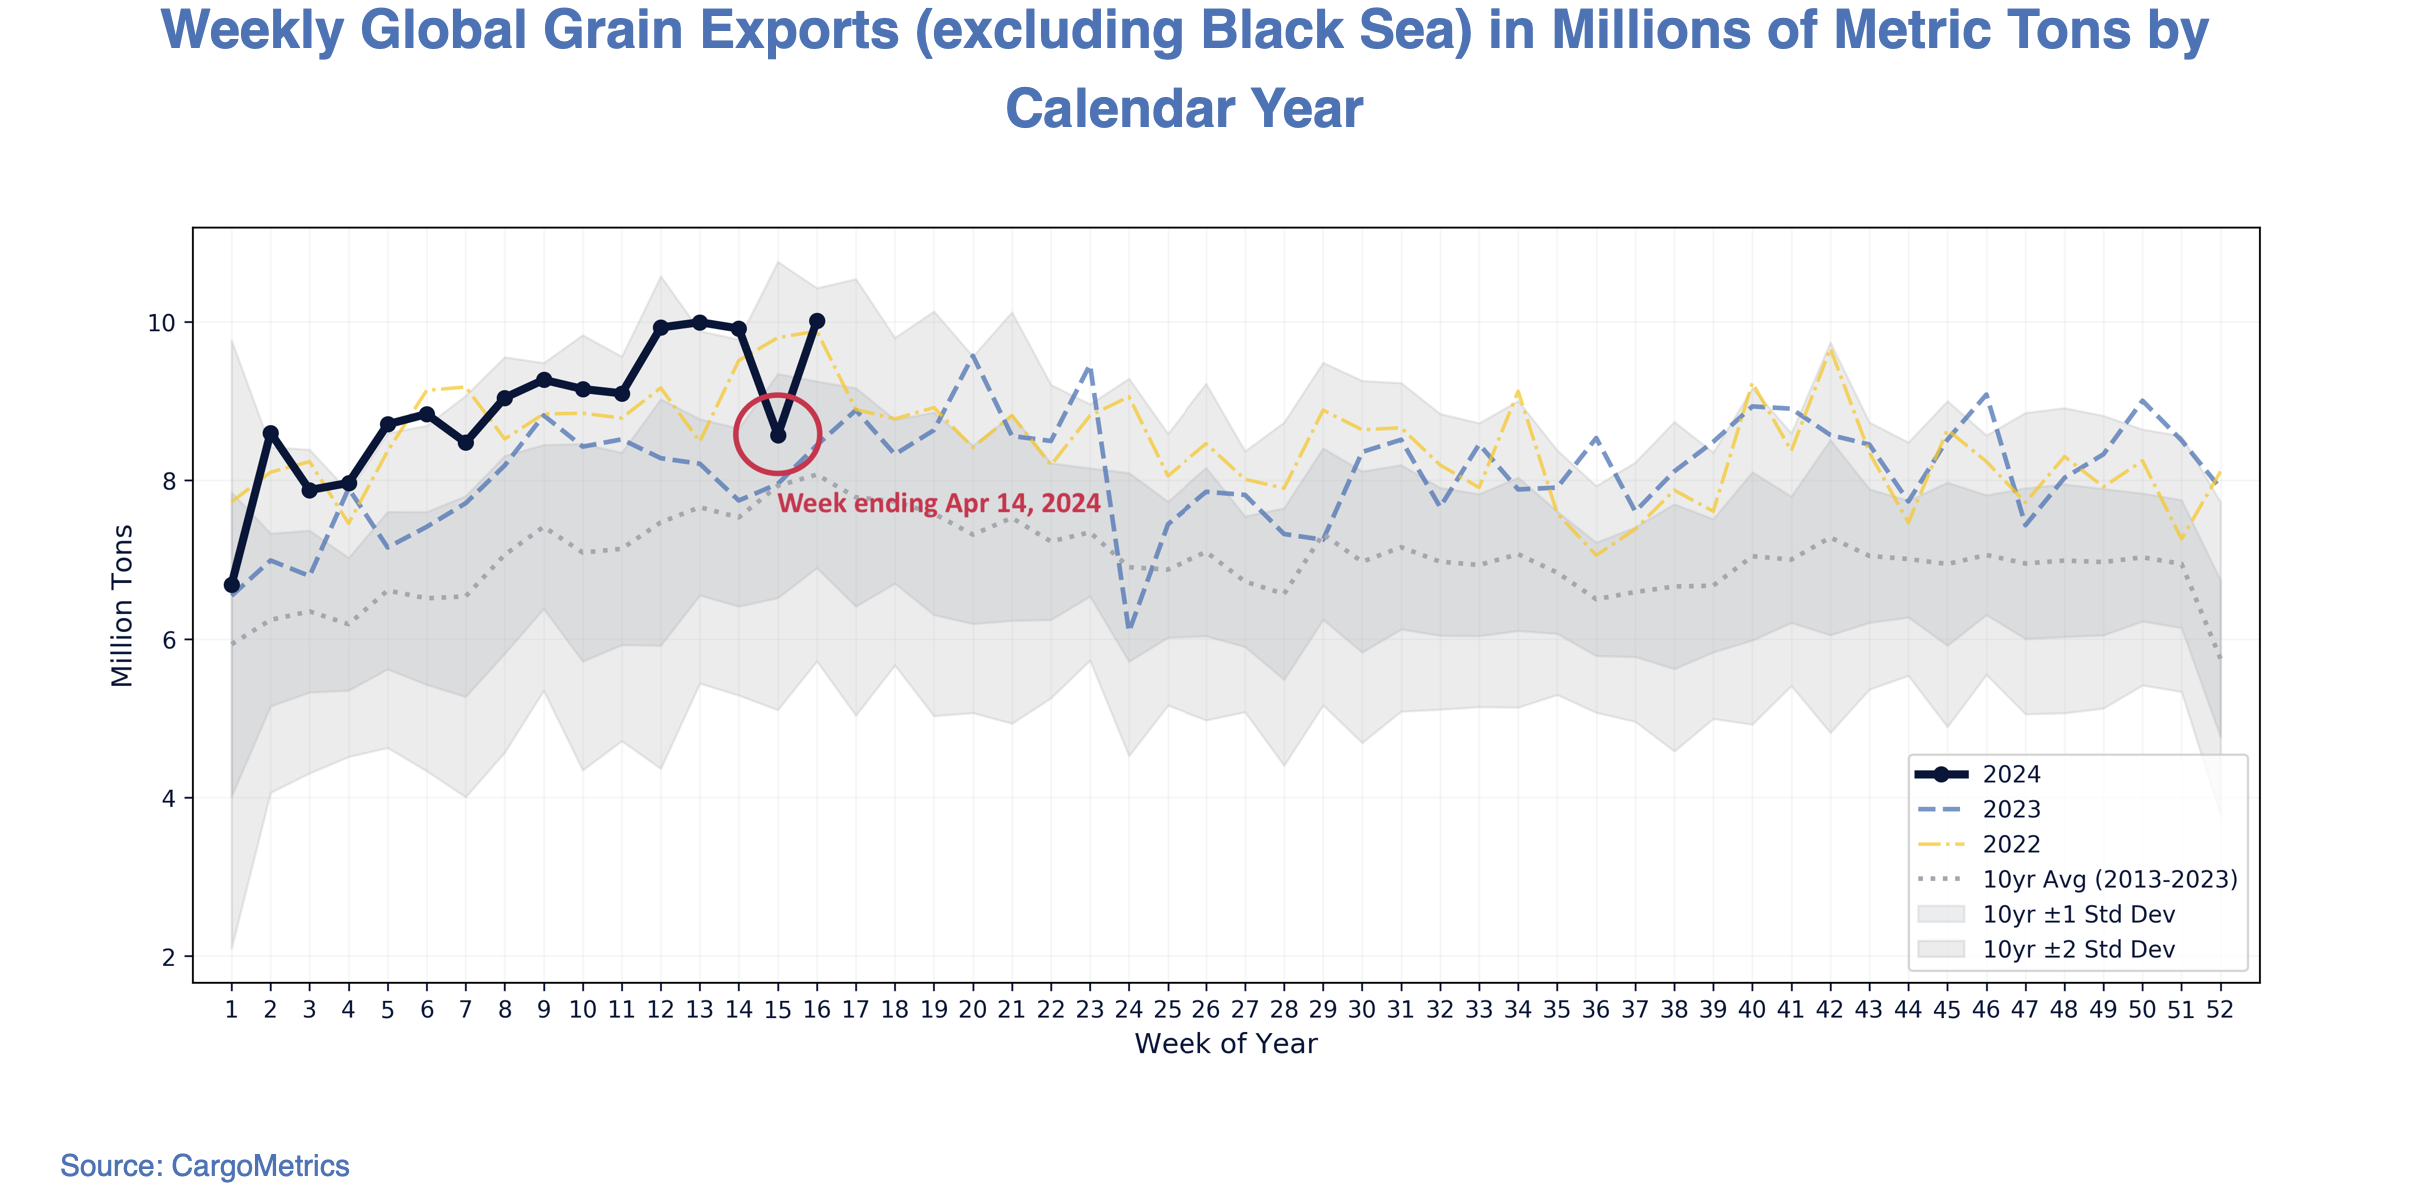
 In contrast, global seaborne exports of grains excluding those from the Black Sea region have been strong to start the year but notably decreased in the week ending April 14, 2024 before returning to the previous weeks’ level.
 Financial Market Implications
After a flat start to the month of April, both front month wheat futures and corn futures prices rose following the decrease in global grain exports.
The implications of shifting export patterns and deviations from average export levels extend beyond the global food supply; they represent opportunity and risk in financial markets. Investment managers, including hedge funds with a quantitative and/or systematic focus, use real-time and historical maritime commodity flow data to research relationships between global grain trade and agricultural futures and spreads, equities, sector ETFs, forward freight agreements (FFA), and macro markets. The data are used in the development of quantitative trading strategies and features for use in trading models, and in the enhancement of fundamental price forecasts – some of which are designed to trade continuously based on trends, fluctuations, and direction and others designed to trade periodically based on events and anomalies.
CargoMetrics Commodity Flow Products
These grain trade insights were obtained from the CargoMetrics Grains Pack – Advanced data product that measures aggregated seaborne grain trade. CargoMetrics publishes a collection of commodity products covering global trade of crude oil, refined oil, LNG, LPG, iron ore, coal, grains, and palm oil. Each product is systematically generated and provides global coverage, point-in-time data, history from 2013 to present, and the ability to model, learn, train, and backtest in order to make reliable, data-driven decisions. CargoMetrics’ data products, including sample data and data dictionaries, are available on Amazon Data Exchange. Our team of researchers and data scientists is available to assist with additional information and analytical support.


